
Humberside Geologist no. 15
The Provenance of the Glacial Tills on the Holderness
Coast, East Yorkshire, UK.
Abstract:
It is proposed that there is a
significant enough difference within the Skipsea Till to separate it into two
different till types (referred to in this paper as Skipsea A and Skipsea B Tills).
This is based on distinct lithologies and particle size distribution. The
provenance of the Skipsea A and Withernsea Tills were determined to be the
western Lake District with the ice route passing through: the Vale of Eden, the
Stainmore Gap (Pennines) and through the Tees Valley. The provenance of the
Skipsea B Till was determined to be southern Scotland and Northumberland with
the ice route being the North Sea ice lobe surges onto the Holderness Coast.
Introduction.
Fieldwork
Site Descriptions
The selected sample sites were the till
beds at the bottom of the exposed cliff face along the Holderness Coast.
Ranging 33.932km from the first sample on
Barmston Sands (NGR
TA1704959253) to sample thirty five at Waxholme (NGR
TA3263330094)
just under two kilometres from Withernsea The sample
sites were approximately every 500m from the previous sample site when
appropriate. The National Grid Reference and a description of the colour of
each sample is
Sampling Methodology
To collect till samples it is important
not to contaminate the samples as this will lead to anomalous results. To
achieve this, the face of the till was scraped away using a clean trowel to
ensure the sample would not be contaminated by external factors. A 1 Kg sample was
removed straight from the till face
Description of soil colou
To quantify soil colour the Munsell soil
colour chart was used. The colours observed are listed with the list of sample
number (Table 1). Samples 1 to 27 are ascribed to the Skipsea
Till by colour and the reddish ones to the Withernsea
|
|
|
|
Munsell |
|
|
|
Barmston |
|
|
|
|
|
Barmston |
|
|
|
|
|
Ulrome |
|
|
|
|
|
|
|
|
|
|
|
Tranmere |
|
|
|
|
|
Skipsea |
|
|
|
|
|
Skipsea |
|
|
|
|
|
Skirlington |
|
|
|
|
|
Atwick |
|
|
|
|
|
Atwick |
|
|
|
|
|
Atwick |
|
|
|
|
|
Hornsea |
|
|
|
|
|
Hornsea |
|
|
|
|
|
Hornsea |
|
|
|
|
|
Hornsea |
|
|
|
|
|
Rolston |
|
|
|
|
|
Rolston |
|
|
|
|
|
Rolston |
|
|
|
|
|
Mappleton |
|
|
|
|
|
Mappleton |
|
|
|
|
|
Mappleton |
|
|
|
|
|
Garton |
|
|
|
|
|
Garton |
|
|
|
|
|
Garton |
|
|
|
|
|
Garton |
|
|
|
|
|
Tunstall |
|
|
|
|
|
Tunstall |
|
|
|
|
|
Monkwith |
|
|
|
|
|
Monkwith |
|
|
|
|
|
Tunstall |
|
|
|
|
|
Tunstall |
|
|
|
|
|
Tunstall |
|
|
|
|
|
Tunstall |
|
|
|
|
|
Waxholme |
|
|
|
|
|
Withernsea |
|
|
|
Particle size analysis
The method used for particle size
analysis in this project is the laser diffraction technique using the
Mastersizer 2000 instrument. This measures particles between 0.02µm and 2000µm.
For the 35 samples taken this instrument automatically goes through three
readings and then presents an average reading per sample. The principle of this
technique is that as the particles pass through a laser beam they scatter the
light at an angle relative to their size. Larger particles disperse the light
at a lower angle and smaller particles disperse light at a higher angle (Ma et al.
Table 2 shows
the percentages of clay, silt and sand contained in the thirty five till
samples. From the table it is clear that the percentage of silt is the most dominant
and the trend generally increases from between sample one and sample thirty
five. There is an overall increase of 18.29%. The lowest silt percentage is found
in sample 8 with a value of 48.32% and the highest percentage is found in
sample 29 with a value of 69.88%.
There is a distinct difference from till sample 14
onwards as the percentage of sand suddenly decreases. Moreover from sample 14
to 28 there is a slight increase in the percentage of clay particles. However
this is not as apparent due to the very high percentage of silt and would have
been difficult to identify from the distribution graphs if the particle size
percentage data from table 2 was not present (see figure 1 for examples).
Moreover, from sample 28 onward it is shown that there is a slight decrease in
the clay percentages. This coincides with the
Table 2: A table showing the
percentages of clay, silt and sand found in the 35 till samples.
|
|
|
|
|
|
|
|
|
|
|
|
|
|
|
|
|
|
|
|
|
|
|
|
|
|
|
|
|
|
|
|
|
|
|
|
|
|
|
|
|
|
|
|
|
|
|
|
|
|
|
|
|
|
|
|
|
|
|
|
|
|
|
|
|
|
|
|
|
|
|
|
|
|
|
|
|
|
|
|
|
|
|
|
|
|
|
|
|
|
|
|
|
|
|
|
|
|
|
|
|
|
|
|
|
|
|
|
|
|
|
|
|
|
|
|
|
|
|
|
|
|
|
|
|
|
|
|
|
|
|
|
|
|
|
|
|
|
|
|
|
|
|
|
|
|
|
|
|
|
|
|
|
|
|
|
|
|
|
|
|
|
|
|
|
|
|
|
|
|
|
|
|
|
|
|
|
|
|
|
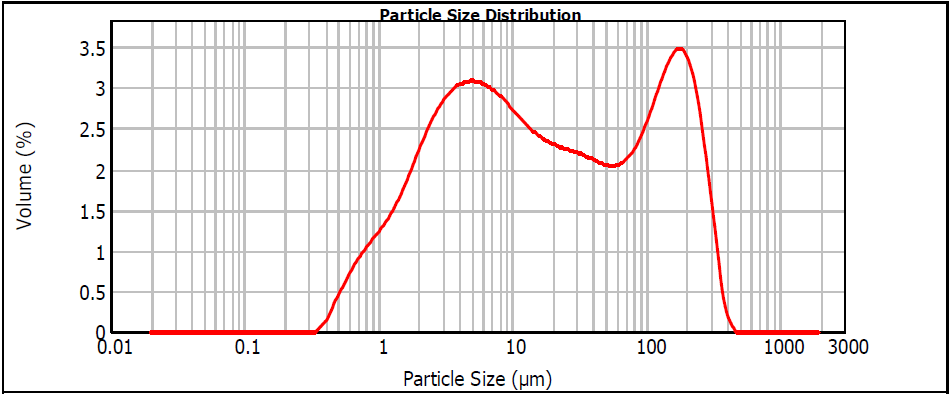
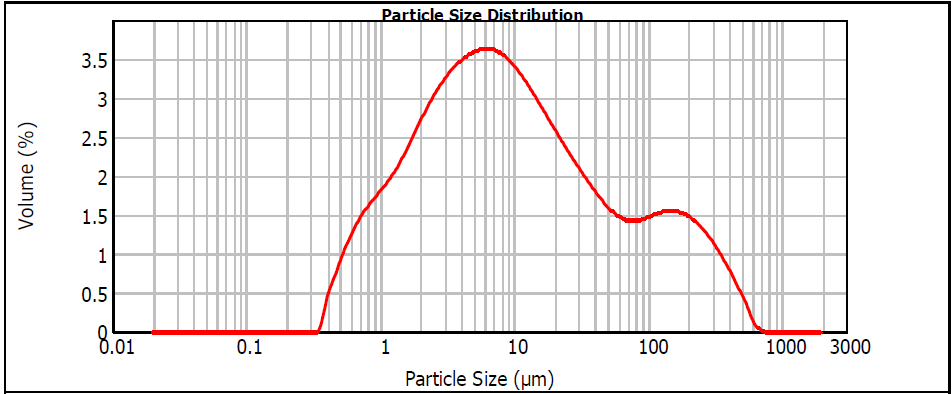
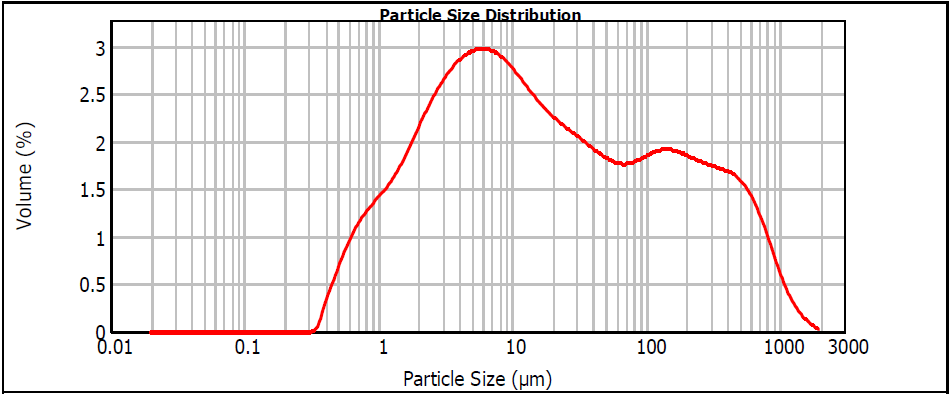
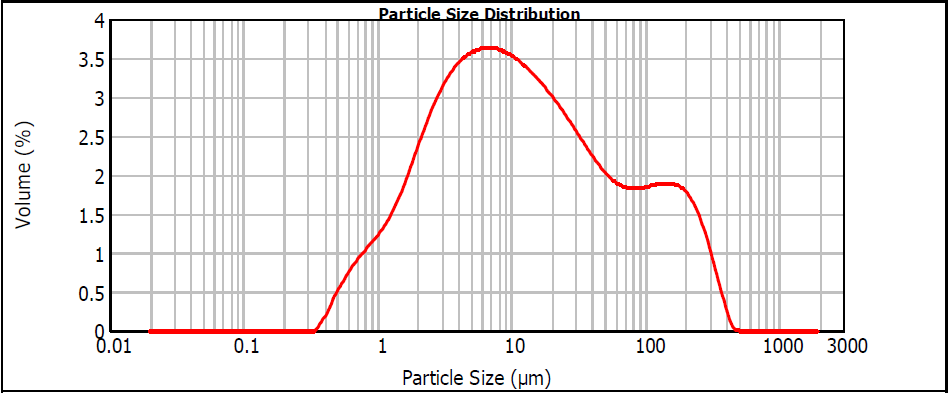
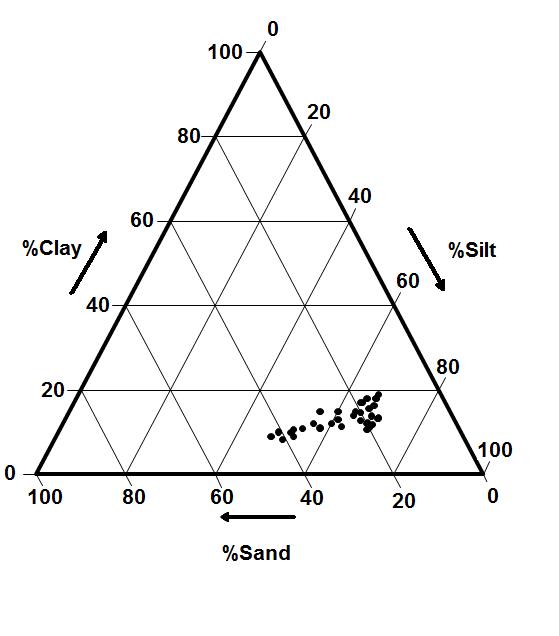
Figure 2.Triangular plot of the results.
X-ray diffraction
Unfortunately, the results for XRD were
both insignificant and sporadic giving no indication of any relationships
within the tills or between any of the till types. Moreover, the results showed
no resemblance to the mineralogical results from past research by Madgett and
Catt (1978). This was probably because Madgett and
Catt had anaylsed
Clast
Roundness
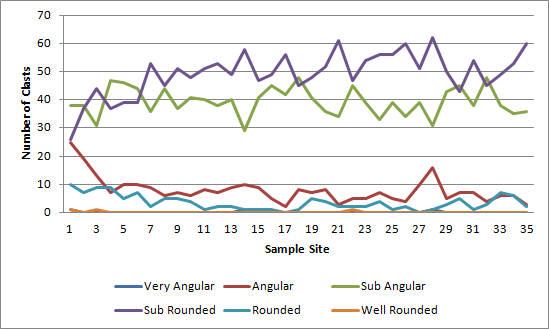
The clast roundness is defined by
Hubbard and Glasser (2005) as the small-scale directional change of a clasts
surface. For this project 100 clasts were collected at each of the thirty five sample
sites giving a total of 3500 clasts
Apart from the first few sample sites
where there is a relatively higher percentage of angular shaped clasts there
appears to be no trend found in the 35 samples where on average the percentage
of sub-rounded clasts is the most dominant with a value of 49.4% with
sub-angular being second most dominant on average 10% less than sub-rounded.
Moreover figure 14 shows that there is very little change found in the 35
samples with the percentages for sub-rounded and sub-angular fluctuating only
slightly from the average with only few major peaks for sub-rounded clasts at
sample sites: 28 (62%), 21 (61%), 26 (60%) and 35 (60%).
Clast
Lithological Analysis *
The purpose of collecting samples for
clast lithological analysis is to obtain a sufficient amount to make the
results statistically significant. The same 3500 clasts
collected for the clast roundness study were used in
this analysis (i.e. 100 from each site). This allowed for a sufficient
comparison between sample sites across a wide ranging distance. Moreover it
provides a better representation of clast types as it will allow a greater
range in those collected. As the sample sites were cliff exposures this
provides ideal conditions for sampling as clasts are readily available.
Furthermore due to the rapidly eroding cliff in Holderness providing a clean
face it means that less time is spent on cutting a new cliff face to access
valid samples. The sizes of the clasts collected for the project were between
40 to80mm. This size range was chosen because it provides large enough clasts
for easy identification. This is because with a smaller size range it would
become too difficult to break a new rock face to help identify the rock type. In
this project systematic sampling was applied whereby a 1m2 area was
marked out on the exposure and starting from the top working to the bottom
collecting all clast types that were in the size range until the required
amount of samples were reached. If a 1m2 area was insufficient in
obtaining the required amount this area would be extended by a further 1m2
until a sufficient amount was collected (Bridgland, 1986).
The aim of lithological analysis is to
correctly identify and classify the individual clasts
in the samples. This therefore requires some basic geological knowledge.
However, it was not possible to identify each individual clast type within a
sample area due to the large range existing. Therefore the clasts were
separated into general categories to allow more manageable data analysis (Gale
and Hoare, 1992). Eight basic rock categories were chosen for this project
based on early observations of prominent clast types. These categories are:
Chalk, Jurassic Sandstone, Jurassic Limestone, Flint, Carboniferous Limestone, Undifferentiated
Red Sandstone, Quartz and Igneous/Metamorphic.
Methods used to separate clast types included breaking the rock to
provide a fresh un-weathered face and the use of hydrochloric acid to identify
if the clast contains carbonates (Bridgland
There appear to be similar trends in the
percentages of clasts present at sample sites in comparison to other test
results such as particle size analysis. It is shown that some of the clast
types display differences in either three distinct sections or differences at
either the first sample sites or the last sample sites. For example the average
number of Chalk samples starts relatively low at around 6% before rapidly
increasing by 34% between sample sites 12 to 28. This number then rapidly
decreases to an average of 10%. The reverse of the Chalk results are the
average numbers of igneous and metamorphic clasts that start very high with a
value of 33% before dropping by an average of 17% between sample sites 12 to 27
then
Table 3: Shows
the percentages of the different clast types at found in the 35 sample sites.
|
|
|
|
|
|
|
|
|
|
|
|
|
|
|
|
|
|
|
|
|
|
|
|
|
|
|
|
|
|
|
|
|
|
|
|
|
|
|
|
|
|
|
|
|
|
|
|
|
|
|
|
|
|
|
|
|
|
|
|
|
|
|
|
|
|
|
|
|
|
|
|
|
|
|
|
|
|
|
|
|
|
|
|
|
|
|
|
|
|
|
|
|
|
|
|
|
|
|
|
|
|
|
|
|
|
|
|
|
|
|
|
|
|
|
|
|
|
|
|
|
|
|
|
|
|
|
|
|
|
|
|
|
|
|
|
|
|
|
|
|
|
|
|
|
|
|
|
|
|
|
|
|
|
|
|
|
|
|
|
|
|
|
|
|
|
|
|
|
|
|
|
|
|
|
|
|
|
|
|
|
|
|
|
|
|
|
|
|
|
|
|
|
|
|
|
|
|
|
|
|
|
|
|
|
|
|
|
|
|
|
|
|
|
|
|
|
|
|
|
|
|
|
|
|
|
|
|
|
|
|
|
|
|
|
|
|
|
|
|
|
|
|
|
|
|
|
|
|
|
|
|
|
|
|
|
|
|
|
|
|
|
|
|
|
|
|
|
|
|
|
|
|
|
|
|
|
|
|
|
|
|
|
|
|
|
|
|
|
|
|
|
|
|
|
|
|
|
|
|
|
|
|
|
|
|
|
|
|
|
|
|
|
|
|
|
|
|
|
|
|
|
|
|
|
|
|
|
|
|
|
|
|
|
|
|
|
|
|
|
|
|
|
|
|
|
|
|
|
|
|
|
|
|
|
|
|
|
|
|
Chalk shows that relatively higher
percentages between samples 12 to 28 were significantly different to the
samples at the beginning and end of the sampling area. Jurassic sandstone was
proven to have had a significantly smaller middle section. Carboniferous
Limestone has significantly larger percentages for sample sites 29 to 35. Flint
proved to have significantly greater percentages in sample sites 1 to 10.
Finally, igneous and metamorphic rocks were proven to have significantly
smaller percentages of rocks for sample sites 12 to 27.
Skipsea
A
Till lithology
The dominant lithologies of the Skipsea
A Till are: igneous/metamorphic (33.1%), Jurassic clasts (28%) and
Carboniferous Limestone (12%). The high percentage of Jurassic clasts indicates
that some of the till is locally sourced from the North York Moors. This could
have been transported by at least two possible routes. Firstly, from the Tees
Valley ice stream which could have picked up the Jurassic
rocks as it moved around the North York Moors after being diverted by the North
Sea ice lobe. This suggested source could also satisfy the other
dominant lithologies due to the origin of this ice stream being the Lake
District which contains Carboniferous Limestone and various igneous rocks (such
as granite and tuff) and south-western Scotland which also contains some igneous
clasts. Another potential source would be the North Sea ice lobe that flowed
down the east coast. This would explain the higher igneous/metamorphic and
Carboniferous Limestone percentage due to the provenance of this ice stream
being Northumberland and south-eastern Scotland where there are abundant
sources of these clast types. This ice stream could have transported the
Jurassic clasts as it moved past the North York Moors. However, this does not
explain the low percentage of Chalk as it would then have to move onto the Chalk
bedrock before deposition at the Skipsea A Till site. However the low Chalk
percentage can be explained with the provenance of the ice flow being from the
Tees Valley. This is because the Tees Valley ice stream could have overridden
the North Sea ice lobe that was surging onto the Holderness coast meaning that
it could not actively erode the underlying chalk be
Skipsea B Till lithology
Withernsea
Till lithology
The dominant
lithologies of the Withernsea Till are: igneous/metamorphic (32%), Jurassic
(19.5%) and Carboniferous Limestone (17.9%). The most probable provenance of
this till, based on the lithology and analysis of geological maps, is similar
to Skipsea A Till, whereby, the high percentage of the dominant lithologies is
due to the ice flow from the Tees Valley and that the low chalk percentage can
be attributed to the overriding of this ice stream, over existing ice sheets,
limiting the percentage of Chalk transported.
Conclusions
The main conclusions that can be gained from this
project are:
·
It was possible to differentiate the samples studied into three
Tills – Skipsea A (samples 1-11), Skipsea
B (samples 12-27) and Withernsea (samples 28-35). The
Skipsea
· That based on a significant difference between particle size distribution and lithological analysis it is suggested that the traditional Skipsea Till can be divided into two separate tills (Skipsea A and Skipsea B). If these tills can be differentiated from one another then it is possible that they have a different provenance that will ultimately indicate the ice route.
· Skipsea A Till and the Withernsea Till have a provenance based on the Tees Valley ice stream. The high percentage of Igneous and Carboniferous Limestone can be explained by the origin of this ice stream being in the Lake District. The high percentage of Jurassic clasts can be explained by this ice stream’s route past the North York Moors before being diverted southwards towards the Holderness Coast by the North Sea ice lobe and the low percentage of Chalk clasts may be because this ice stream overrode the ice surging in from the North Sea meaning that it was unable to erode the Chalk bedrock.
·
The
overall provenance of Skipsea B Till is that it was most likely deposited by
the North Sea ice lobe. This is because they have similar clast orientations
and share clast provenance, such as Igneous clasts from the Cheviots or
Scotland and Carboniferous Limestone from Northumberland.
References
Gale, S.J. and Hoare, P.G. (1992)
Quaternary Sediments: Petrographic
Methods for the Study of Unlithified Rocks.
International Books Distributors.
Hubbard, B. and Glasser, N. (2005) Field
Techniques in Glaciology and Glacial Geomorphology.
Wiley. Chichester.
* Editors' Comment - Whilst the methodologies used to process the samples are scientifically sound, the editors believe that the groupings used for the clast identification are quite broad. For instance the Old Red Sandstone and New Red Sandstone are in the same group. The grey, black and red flints are not differentiated. These rocks have different original sources and are likely to have travelled on different glacial routes. There is no mention of Scandinavian erratics, though they may have been a bias in the 4 to 8 cm clast fraction. This could affect the conclusions about ice stream directions.